Wednesday 28 December 2011
Thursday 22 December 2011
‘Climate is an ill-tempered beast, and we are poking it with sticks’
As shown over the last few posts, abrupt climate changes are very unique in the study of past environmental change. That atmosphere-ocean-sea ice coupled changes that take place highlight the importance of feedbacks in the earth’s system and of an earth science approach to understand this change. Whilst conceptual advances have provided frames for theories and models about how signals in the climate system are transmitted, many questions remain. For instance, which element of the climate system is responsible for the millennial-scale climatic changes that appear in ice-core data? High-resolution synchronized ice-core data, in conjunction with high-resolution marine-sediments from the Atlantic and Southern Oceans are two ways which will approve our understanding. Furthermore, not one element (i.e. external vs internal ice-sheet dynamics debate) but a combination of factors may be responsible for millennial-scale climate variability. However, more crucially than the above, is awareness and recognition of a point.
That a divergence exists between palaeoclimate data and models (I highlighted this point all the way back in point 2, but to elaborate here, I refer to resolution). Whilst palaeoclimate records have beyond doubt increased our understanding of the earth’s climate system (which is not a point I’m at all contesting), a divergence is still apparent between these records and the processes taken into account in models used to predict the impact of increases in global mean temperature projected due to climate change. This has led to the acknowledgement of uncertainty in the context of climate change which has fuelled scepticism and potentially inaction, in regards to the appropriate policy response, at the global scale.
(The above reference can be found in Mark Maslin’s (2004) book: Global Warming: A very short introduction, to paraphrase of Wally, S. Broecker, a notable scholar who has made a significant contribution to the advancement of palaeoceanography).
Monday 19 December 2011
Bipolar Climate Seesaw and Deep Ocean Circulation
In response to the conundrum: it is better to think in terms of asynchrony.
The behaviour of the North and South hemispheres, would suggest that the nature of the climate system is analogous to a seesaw, with each hemisphere taking turns to drive the system. (Note; this change is in response to millennial-scale climate variability). To revisit, it has been acknowledged that iceberg discharges into the North Atlantic caused a disruption of the Atlantic meridional overturning circulation (AMOC), causing a cooling of northern hemisphere and warming of Antarctica (Rahmstorf,2002) . This one of two schools of thought on mechanisms of millennial-scale climate variability (externally forced climate change and internal ice-sheet dynamics, the former is what we will focus on in this post).
There has been a substantial volume of literature written on the subject of ‘seesaw’. Broecker (1998) coined the term; in light of the thesis that abrupt cooling in the North Atlantic would leave a distinctive signal in the South Atlantic; with changes in the north and south occurring in synchrony. Stocker (1998), also suggested an oceanic seesaw whereby changes are driven by high-latitudinal or near-equatorial changes or, a combination of both.
However, the original bipolar seesaw concept has been subject to scrutiny (Stocker and Johnsen, 2003). Firstly, the original bipolar seesaw model suggests that changes in north and south occurred in phase. This is out of course divergence from records in Antarctica and Greenland and also for the fact that this requires very fast heat transmission in the oceans (which as we now, is difficult given the thermal inertia of the oceans). It also must be noted that the bipolar seesaw must not be used as an all-encompassing term to describe all climate changes where interhemispheric connections exist; it is a term to describe responses to millennial-scale climatic changes.
Stocker and Johnsen (2003) postulate a ‘thermal bipolar seesaw’, by coupling a heat reservoir to the original bipolar seesaw model (Figure 1). They apply this conceptual model to GRIP and Byrd data (shown in last post) and highlight that correlation can be achieved on a timescale of 1000-1500 years.

Figure 1. Schematic model of the thermal bipolar seesaw. The bipolar seesaw is joined to a heat reservoir (potentially the Southern Ocean). Double arrow indicates that heat exchange with the reservoir is taken to be diffuse.
Source: Stocker and Johnsen (2003).
In short, the model suggests that the asymmetric response of both hemispheres can be explained by a bipolar seesaw mechanism in which changes in the strength of AMOC can contribute to changes in interhemispheric heat transport.
However, what is the likely to drive changes in this seesaw?
Due to large volume and thermal inertia, it is likely the deep ocean is likely (Rahmstorf, 2002). There is however, an additional complexity; the notion of thresholds in north-atlantic deepwater system. Based on Greenland and the Iberian margin, Rahmstorf (2002) shows there are 3 modes; stadial, interstadial and Heinrich mode (Figure 2). In the interstadial mode (warm, modern and interglacial), North Atlantic Deep Water (NADW) forms in the Nordic seas. In the stadial mode; it forms in the subpolar open North Atlantic (leading to a cold, glacial D-O stadial) and in the Heinrich mode, NADW formation all but ceased and waters of Antarctic origin filled deep Atlantic basin.
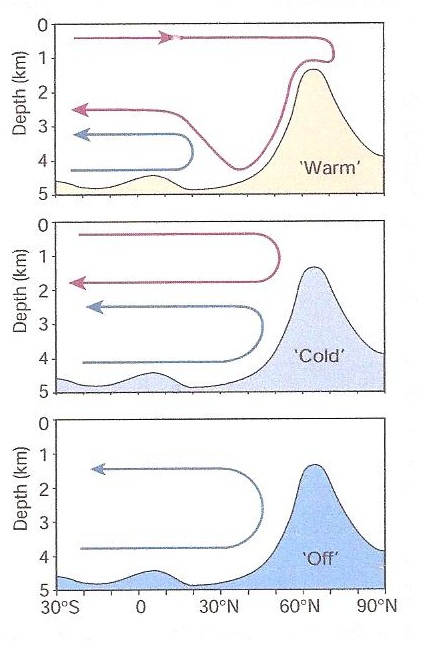
Figure 2: Schematic version of the three modes (‘warm’, ‘cold’ and ‘off’) of ocean circulation as observed during different times of the last glacial period. Shown is the section along the Atlantic, with NADW highlighted by the red line and AABW by the blue line.
Source: Rahmstorf (2002).
There is an enormous difficulty in quantifying the risk of abrupt changes in deep-water circulation. This is due to the possibility of a NADW bifurcation, coupled with the fact that we do not know the state of the current climate system with regards to the threshold (a point I made all the way back in post 2).
These 3 modes of deep water circulation and the bipolar seesaw mechanism highlight the non-linearity and uncertainty in our understanding of millennial-scale climate variability. This in turn, has significant implications when trying to understand and predict the impacts of climate change.
Saturday 17 December 2011
Interhemispheric comparisons
Returning to the conundrum in post 13, one of the most important finds in the study of millennial-scale climate variability is that the response of the North and South hemispheres are out of phase.
The Southern hemisphere has not received much attention so far in the blog post, but as we shall we see in this post and the next post, it holds vital importance for our understanding of global ocean circulation) (Blunier et al., 1998). Blunier et al. (1998) showed that Greenland warming around 36 and 45 kyr before present (BP) lagged Antarctica by 1 kyr. Therefore, in order to synchronize both records, the authors use methane (CH4) records from the last glaciation from 2 Antarctic ice cores (Byrd station 80°S, 120°W, Vostok 78.47°S, 106.80°E ) and 1 Greenland ice core (GRIP ice core summit, 72.58 °N, 37.64 °W). CH4 has an approximate residence times of c. 10 years in the atmosphere. The advantage of using CH4 as a tool for synchronisation is that it has a residence time that is long enough to become globally homogenous but is also short enough to react quickly to budget imbalance linked to climate changes. Therefore any changes in concentration should be synchronous between Antarctica and Greenland (Figure 1).

Figure 1: GRIP, Byrd and Vostok isotopic and CH4 records on the common timescale (GRIP timescale in years before 1989).Antarctic warming as indicated by A1 and A2, with vertical dashed lines indicating the location of Greenland warmings 1,8 and 12 in the Antarctic cores.
Source: Blunier et al. (1998)
On average, the authors found that the change in Antarctic climate leads Greenland on an average of 1 1±2.5 kyr across the period 47±23kyr BP. One of the greatest findings of Blunier et al. (1998)’s observation is that the records dispelled any notion of a coupling between Northern and Southern hemispheres via the atmosphere, an idea postulated by Bond et al. (1993). Crucially, the findings potentially favour an ocean connection in order to conceptualise this behaviour.
One of the greatest challenges in climate science is the ability to derive a mechanism that accounts for the observed behaviour of high-latitude north and south hemispheres.
Any such mechanism would need to address the following conundrum (forgive my use of intertextuality with reference to arguably one of the most famous authors in English literature):
To be in Phase or To be in Antiphase?
That is the question…
Sunday 11 December 2011
What does Durban mean for the world?

So the news is out. After a frantic extra day of negotiations that continued late into Saturday night, a deal has been struck. So what exactly is this all about?
In a nutshell:
- The EU came to Durban calling for a mandate to negotiate a legally binding deal on climate change by 2015.
- However, EU clashed with India and China over the legality of a new agreement, threatening to put the talks between 194 countries into jeopardy.
- The EU wanted to push a “roadmap”, which would establish a new over-arching agreement that would commit countries to emission cuts. India and China, expressed concerns at the legality of such proposals, preferring to adopt the term ‘legal outcome’ as oppose to “legal instrument” in the agreement (The Guardian, 2011).
- After the South African President urged the EU and India to go into a huddle to resolve the language dispute, a Brazilian compromise saw an agreement between both parties to negotiate another legal instrument or an ‘agreed outcome with legal force’ (The Guardian, 2011).
- The treaty will be negotiated by 2015 and implemented from 2020. It will also allow action to address the emission deficit between voluntary reductions and those experts state are needed to tackle climate change.
- As a side issue, ministers had agreed that by 2020, a $ 100 bn fund to help countries move to a green economy and tackle the effects of climate change in addition to measures to protect forests and develop global markets.
These talks are part of a series of wider issues; and I have neatly summarised them below. The figures are referenced by Mark Maslin’s ‘Global Warming: A Very Short Introduction’, a very accessible text exploring all dimensions of the issue.
Why do we need a legally binding agreement?
- Legally-binding multilateral agreements through the United Nations Framework Convention on Climate Change to cover emissions from all countries are the only viable way to keep an increase in global average temperatures since pre-industrial period below 2 °C, a threshold widely agreed to mitigate "dangerous" climate change.
Why the urgency for a legally binding agreement?
- To summarise climate science, the earth has a thermal lag meaning so even if emissions stopped today; the earth’s temperature will still rise (Current estimates are we have experienced 0.5- 1°C warming already).
- The political issue is essentially a game of risk; what temperature and hence, CO2 concentration do we aim for?
- A ‘two-degree’ world is seen as the threshold as scenarios based on temperature rises beyond this to 3, 4 , 5 and 6 °C will involve a complex series of feedbacks that will affect humanity’s ability to adapt to climate change.
- In order to reach 2°C, we need to peak global emissions by 2015 at a CO2 concentration of 400 ppm (we are currently at 390.91 ppm). Thus, a legally binding treaty is required to give any hope of achieving this (or staying in the 2-3 °C margin).
Why the difficulty?
As witnessed at the Durban talks with the conflict over the use of language between the EU, China and India, there are some key issues in such global negotiations I would like to point out:
-
- Trust: The developing countries and ‘fast-emitters’ (e.g. India and China) are concerned by ‘green colonialism’, the concept that developed countries should dictate to developing countries how they should develop and what action they should take, actions they feel will supress their right to a fair development trajectory.
- Geopolitics: As China rose at the talks, they felt the EU’s roadmap proposals would be mostly beneficial to the US. Multilateral talks need a global political view. The US’s importance, economically, politically and as a large emitter, requires its participation in order for a global community to develop on climate change.
- Leadership: Tied in with the above, a united long-term vision is required from political leaders across the globe. That even in an era of economic austerity, a long-term vision and pathway must be clearly set to adapt to climate change to prevent a future social, economic (potentially greater than the recession), environmental and political catastrophe.
What should an agreement include?
To briefly conclude. The Durban summit could be looked back on as a success if the negotiations on a treaty outlined in the talks are implemented. So what could this include?
- Contraction and Convergence
This is the idea proposed by Meyer (2000) that the largest emitters of greenhouse gases contract the level of pollution towards an agreed per capita emissions total. For example, the US CO2 emissions/person are 10 times that of China. As a global community, we need to try and keep the amount emitted per person the same. Therefore, every country has to contract their emissions, some more than others. For the developed world, this means a low-carbon economy is a serious alternative. This agreement should be open and transparent and include the developing world in order to invoke the concept.
- A Green Economy
C
Carbon markets, initiated in Kyoto, need to become global carbon markets in order to accelerate capital flows from the developed to developing world. I believe the concept of a green economy can act as a framework by developing global institutions that allow the development of such markets, renewable energy technologies and capital flows between the developed and developing world. This would accelerate the capitalist system to accelerate a positive response by encourage investors and other actors in the private sector, and minimise the regulatory risk that has been witnessed for more than a decade as the world just watches conference after conference of inaction.
Chris Huhne, the UK climate change secretary, said the deal represented a “significant step forward” (The Guardian, 2011) . Let us hope he is right….
Saturday 10 December 2011
Part two: Mechanisms
After introducing D/O cycles and Heinrich events, we now turn to review the mechanisms associated with millennial-scale climatic processes. In a nutshell, there are two competing theories in the literature; externally forced global climate change and internal ice sheet dynamics (Maslin et al., 2001 in Seidov et al., 2001). The former shall be the subject of an upcoming post, as mechanisms of iceberg discharges are the subject of the current post.
The prevailing hypothesis is the Binge-Purge hypothesis caused by internal stability of the Laurentide Ice Sheet, formulated by MacAyeal (1993) (Figure 1). Essentially, ice sheets on unconsolidated sediments when frozen acts analogous to cement, supporting the weight of the growing ice sheet. Upon ice sheet expansion, geothermal heat from the earth’s crust in conjunction with that from ice-ice friction, trapped by the overlying ice sheet, causes an insulating effect. This causes the temperature of the sediment to increase until a critical threshold is reached. Here, sediment becomes soft causing the base of the ice sheet to allow ice overflow through the Hudson strait to the North Atlantic. This in turn, can lead to a sudden loss of ice mass and reduce the effect of refreezing to the point when ice reverts a phase of slow-build up. MacAyeal (1993) observes that this system of progressive ice build-up, melting and surge followed by renewed build up have a periodicity of approximately 7,000 years when compared to intervals between the last Heinrich events (outlined in the last post).

Figure 1. A simple kitchen oscillator as an analogy to describe the Heinrich event cycle of the Laurentide Ice Sheet. Initially, the container sits upright as the centre of mass is assumed to position between the bottom of the container and the axle. As water drips slowly (binge phase), the centre of mass rises to a point where it exceeds the axle, causing the container to become unstable and purge the contents onto the floor (purge phase). Once the container has been emptied, it reverts back to the initial upright position and slowly fills with water, thus repeating the cycle.
Source: MacAyeal (1993)
Buttressing ice shelves and ocean forcing can also be attributed as another mechanism (Hulbe, 2010). This can be seen in the form of a pervasive coupled ocean, ice-shelf and ice-sheet mechanism of mass flow (Alvarez- Solas et al., 2010). Snow accumulation on ice sheet encourages glacial flow via an ice shelf, and is lost via melting. When this is forced to occur against ocean-driven changes, the ice sheet responds with iceberg discharge. The frequency of this response is modulated by the rate of snow-accumulation and ice-stream sliding. Changes in the rate of snow-accumulation could attribute for the production of irregular Heinrich events.
These concepts highlight the complexity of debate in internal ice sheet dynamics as processes of millennial-scale climate variability. We now turn to questions of impact and one of the most remarkable findings in the study of millennial-scale climate events…..
Friday 9 December 2011
Millennial-scale climate change: an introduction
Before we turn to questions of predictions of future impacts of climate change, it is important to conceptualise the last several blog posts. Earth systems science is one such framework, defined as an integrated earth system including human activities (Barron and Seidov, 2001 in Seidov et al., 2001). In relation to ocean circulation this can be understood two-fold, ocean, atmospheric and cryosphere feedback and the timescales over which such processes occur. The last several blog posts concerned events when meltwater forcing may have caused a series of changes in the North Atlantic Meridonal Overturning Circulation. These events are examples of abrupt climate change (decades) which occur on millennial timescales (103 yr) with significant changes in air temperature and sea surface temperatures observed. This is a primer for a series of posts which shall explore the mechanisms behind such processes, records available and they have in turn have influenced our conceptualisation of ocean forcing.
Two processes are thought to contribute to abrupt climate change experienced in the ocean during the last glacial period; Heinrich Events and Dansgaard-Oeschger Cycles (hereinafter referred to as D/O cycles). First identified in the Greenland ice core, D/O cycles are a succession of warm events lasting decades (interstadials), which characterize Greenland ice core records of the last glacial episode and cold events (stadials), as found in ice rafting records of the North Atlantic, which last for centuries (Dansgaard et al. 1993). These events are thought to be of high frequency and low amplitude, in a 1500 year cycle. Heinrich events on the contrary, are of low frequency and high amplitude. These ice-rafting debris (IRD) events, thought to be global in impact, have occurred six times in the last glacial, from 70,000 to 14,000 years ago (Figure 1). (Hulbe, 2010).

Figure 1. Heinrich events during the last glacial. Glacial North Atlantic cycles of warming and cooling, shown
in the oxygen isotope record from Greenland ice cores, are punctuated with iceberg discharge events (represented by blue bars) lasting approximately 500 ± 250 years.
Source: Hulbe (2010: 81)
Heinrich events coincide with D/O cycles, though the connection is tenuous. They do not occur during the cool phase of a D/O cycle per se, but can be thought of as extreme D/O stadials. Essentially, a Heinrich event requires three essential conditions; source of sediment, mechanism whereby sediment is moved up into glacial ice and transported into the ocean and a process that varies the rate of iceberg production (which are debated to be either processes internal to the ice sheet or forcing from other factors in the climate system) (Hulbe, 2010).
Stay tuned for part two…
Subscribe to:
Posts (Atom)